Pictorial representation of FHIR resouces
March 28, 2014 5 Comments
We’re been talking about the best way of representing how FHIR resources relate to each other. It’s reasonably easy to do this for technical people – they’re familiar with the idea of tools like UML models and XML / XML Schema, but not so easy for clinicians and other non-technical folk.
FHIR is based the concept of resources that can relate to each other – a term I’ve heard used is that they represent a ‘web’ of resource connections, which is quite a nice analogy. It’s exactly how the World Wide Web works – and everyone knows how to use the web, but fewer are familiar with the standards and constructs that underlie how all this works.
A resource (as you doubtless know by now) represents a particular ‘thing’ that makes sense as a separate entity. Examples are patient, practitioner, condition (problem), encounter, allergy etc. A resource contains a collection of properties (like name, date of birth, address), and these properties either have a value (and the structure of that value can be complex – that’s the datatype) or is a reference to another resource (hence the concept of the web of resources).
We thought it might be interesting to represent these connections as a connection of nodes, where each node is a resource (the other properties of the resource aren’t shown in these diagrams).
Note that this is a ‘specification’ view – it shows the connections that are defined in the spec, not necessarily how you’d represent them in a real instance. For example, where a single property could be linked to different types of resource then both links are shown. Also in a real situation you’d probably put the patient in the centre and there would be multiple instances of many of the resources.
And also links (references) can be added using extensions…
So here are some diagrams for some of the clinical concepts – just to see if they are useful (Note that the colours of the resources don’t have any significance).
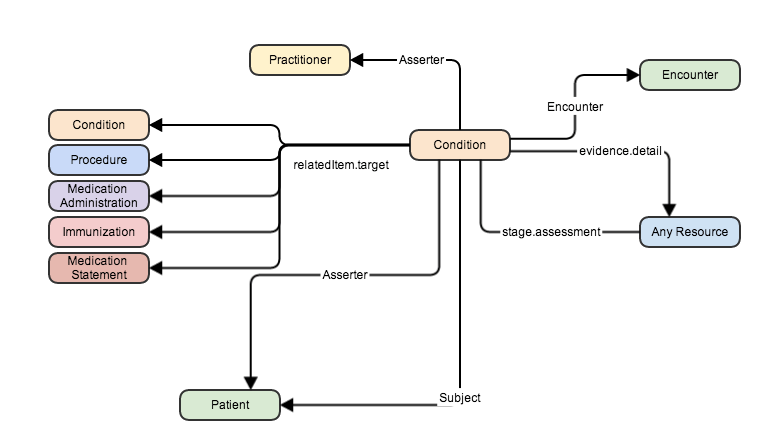
First up is the Condition resource (earlier known as the Problem resource)
Next are medications. These are a wee bit more complex as we have
- Medication (a drug)
- MedicationPrescription (what the patient should be taking)
- MedicationAdministration (a single administration of a dose of a drug)
- MedicationDispense (medications dispensed to a patient)
- MedicationStatement (a record that a patient is taking a medication)
So we’ll use a couple of diagrams.
One based on the MedicationPrescription (and including details of the Medication)

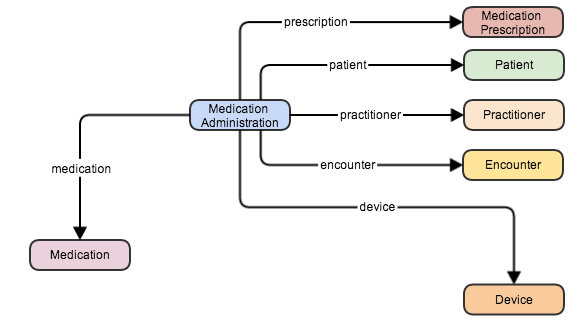
And another for MedicationAdministration
And finally lets think about allergies. There are a couple of key resources here – AllergyIntolerance (which records what the allergy is to and who recorded it), and AdverseReaction – which records the actual reaction that occurred.

Well, that’s all I’m going to do at the moment – I’m not 100% sure how valuable these representations are, if you like them and want me to do more then leave a comment!
And remember – these relationships are just what the core spec refines. They can be adjusted and augmented to meet your own business cases using Profiles and Extensions.
I think this could be valuable for people just getting into health data. Please do more!
Thanks! You may be interested in a presentation I did to a group of clinicians at a recent seminar – there’s a link to it in this post:http://fhirblog.com/2015/10/21/fhir-at-the-new-zealand-hinz-conference/
cheers…
Oh – and there’s a more general course here: https://www.coursera.org/learn/fhir/?utm_medium=email&utm_source=other&utm_campaign=notifications.auto.UQW-y3w1EeWxzQquOdn0aw
Hi David,
I have been using BPMN to create diagrams. Both technical and non-technical can understand them. And it’s an industry standard.
Hi Howard – if you want to do the equivalents for the images here, happy to post them as well…